> For the complete documentation index, see [llms.txt](https://docs.shimoku.com/dev/llms.txt). Markdown versions of documentation pages are available by appending `.md` to page URLs; this page is available as [Markdown](https://docs.shimoku.com/dev/elements/charts/area-charts/segmented-area.md).
# Segmented Area
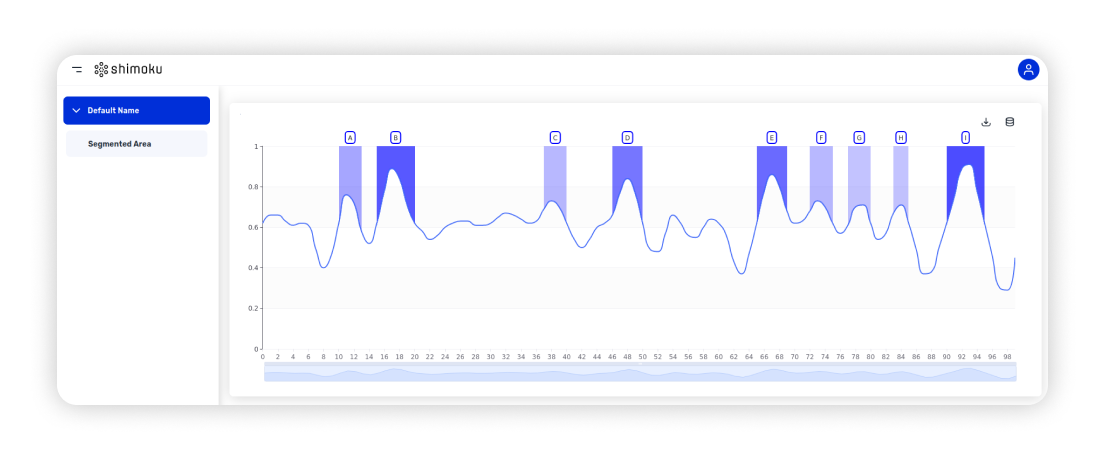
The Segmented Area Chart offers a blend of line and area chart elements, where specific segments or periods are highlighted with color fills between the data line and the x-axis. These colored segments draw attention to particular events or ranges in the data, making it beneficial for emphasizing changes or anomalies within a continuous dataset.
## The Method To Use
The method is `s.plt.stacked_area()`
It must contain the following input variables:
```python
data: Union[str, DataFrame, List[Dict]]
order: int
x: str
y: str
```
and accepts these parameters as optional:
```python
segments: Optional[list] = None # Explicit segments
x_axis_name: Optional[str] = None
y_axis_name: Optional[str] = None
default_color: Tuple[int, int, int] = (255, 0, 0)
title: Optional[str] = None
rows_size: Optional[int] = None
cols_size: Optional[int] = None
padding: Optional[List[int]] = None
show_values: Optional[List[str]] = None
option_modifications: Optional[Dict] = None
variant: Optional[str] = None
top_area: bool = False # To specify if the area has to be painted on top
threshold: Optional[float] = None # To calculate segments from the value of y
labels: Optional[List[str]] = None # The labels of the segments
```
## Examples
The next examples use this dataset and labels:
```python
noise_data = pd.DataFrame({
'x': range(100),
'y': [
0.62, 0.66, 0.66, 0.63, 0.61, 0.62, 0.61, 0.49, 0.40, 0.46,
0.62, 0.76, 0.72, 0.58, 0.52, 0.62, 0.78, 0.89, 0.84, 0.71,
0.62, 0.58, 0.54, 0.56, 0.60, 0.62, 0.63, 0.63, 0.61, 0.61,
0.62, 0.65, 0.67, 0.66, 0.64, 0.62, 0.63, 0.69, 0.73, 0.70,
0.62, 0.54, 0.50, 0.54, 0.60, 0.62, 0.66, 0.77, 0.84, 0.77,
0.62, 0.49, 0.48, 0.57, 0.66, 0.62, 0.56, 0.55, 0.60, 0.64,
0.62, 0.56, 0.43, 0.37, 0.47, 0.62, 0.78, 0.86, 0.80, 0.68,
0.62, 0.63, 0.68, 0.73, 0.70, 0.62, 0.57, 0.61, 0.70, 0.71,
0.62, 0.54, 0.57, 0.67, 0.71, 0.62, 0.49, 0.37, 0.38, 0.50,
0.62, 0.75, 0.89, 0.91, 0.78, 0.62, 0.46, 0.30, 0.29, 0.45
]
})
labels = [
'A', 'B', 'C', 'D', 'E', 'F', 'G', 'H', 'I', 'J', 'K', 'L', 'M',
'N', 'O', 'P', 'Q', 'R', 'S', 'T', 'U', 'V', 'W', 'X', 'Y', 'Z'
]
```
{% hint style="info" %}
The number of labels doesn't need to be equal to the number of segments of area.
{% endhint %}
The fist example shows the use of the threshold parameter:
```python
s.plt.segmented_area(
data=noise_data, order=0, x='x', y='y', threshold=0.7, labels=labels
)
```
The second example show the behavior of the parameters `top_area` and `default_color`.
```python
s.plt.segmented_area(
data=noise_data, order=0, x='x', y='y', threshold=0.7,
top_area=True, default_color=(0, 0, 255), labels=labels
)
```
And the final example shows how to define the segments directly, color can be specified in each segment too:
```python
s.plt.segmented_area(
data=noise_data, order=0, x='x', y='y',
segments=[(30, 45), (60, 70, 'var(--chart-C1)'), (75, 95, (1, 220, 1))]
)
```
## Variants
By setting the parameter `variant` to the following values the appearance of the chart can be changed:
{% tabs %}
{% tab title="Clean" %}
variant="clean"
{% endtab %}
{% tab title="Minimal" %}
variant="minimal"
{% endtab %}
{% endtabs %}
---
# Agent Instructions
This documentation is published with GitBook. GitBook is the documentation platform designed so that both humans and AI agents can read, navigate, and reason over technical content effectively. Learn more at gitbook.com.
## Querying This Documentation
If you need additional information that is not directly available in this page, you can query the documentation dynamically by asking a question.
Perform an HTTP GET request on the current page URL with the `ask` query parameter, and the optional `goal` query parameter:
```
GET https://docs.shimoku.com/dev/elements/charts/area-charts/segmented-area.md?ask=&goal=
```
`ask` is the immediate question: it should be specific, self-contained, and written in natural language.
`goal` is optional and describes the broader end goal you are ultimately trying to accomplish on behalf of the user. GitBook uses it to tailor the answer towards what is most useful for that goal.
The response will contain a direct answer to the question and relevant excerpts and sources from the documentation.
Use this mechanism when the answer is not explicitly present in the current page, you need clarification or additional context, or you want to retrieve related documentation sections.