> For the complete documentation index, see [llms.txt](https://docs.shimoku.com/dev/llms.txt). Markdown versions of documentation pages are available by appending `.md` to page URLs; this page is available as [Markdown](https://docs.shimoku.com/dev/elements/charts/bar-charts/bar.md).
# Bar
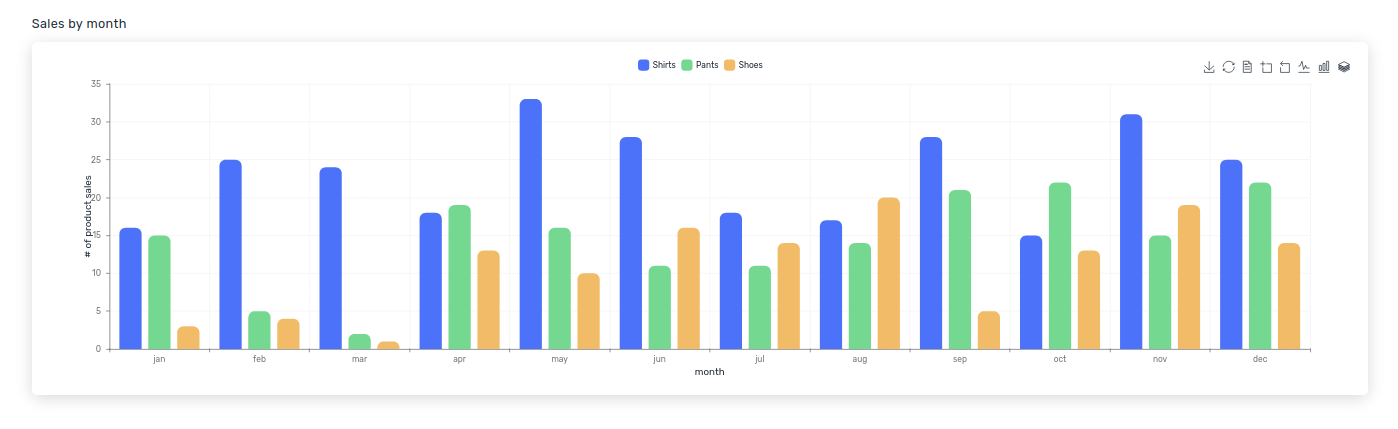
A **bar chart** uses vertical bars to show comparisons between categories of data. Vertical bar charts illustrate sizes of data using different bar heights.
## The Method To Use
The method is `s.plt.bar()`
It must contain the following input variables:
```python
order: int
x: str
data: Union[str, DataFrame, List[Dict]]
```
And accepts the following input variables as optional:
```python
y: Optional[List[str]]
x_axis_name: Optional[str]
y_axis_name: Optional[str]
title: Optional[str]
rows_size: Optional[int]
cols_size: Optional[int]
padding: Optional[List[int]]
show_values: Optional[List[str]]
option_modifications: Optional[Dict]
```
## Examples
### 1. Default Configuration
By default the chart will have `rows_size=2` and `cols_size=12`, also it will have no padding applied. An example on how to use the default configuration is:
```python
data = [
{'date': dt.date(2021, 1, 1), 'x': 1, 'y': 10},
{'date': dt.date(2021, 1, 2), 'x': 2, 'y': 8},
{'date': dt.date(2021, 1, 3), 'x': 3, 'y': 10},
{'date': dt.date(2021, 1, 4), 'x': 4, 'y': 2},
{'date': dt.date(2021, 1, 5), 'x': 5, 'y': 14},
]
s.plt.bar(data=data, order=0, x='date')
```

### 2. Customization And Context
It is possible to personalize the **title** of the chart, name of each **axis**, the **legend,** changing **size** and add **padding**. One example could be obtained using:
```python
data = [
{'date': dt.date(2021, 1, 1), 'store 1': 5, 'store 2': 10},
{'date': dt.date(2021, 2, 1), 'store 1': 6, 'store 2': 8},
{'date': dt.date(2021, 3, 1), 'store 1': 4, 'store 2': 10},
{'date': dt.date(2021, 4, 1), 'store 1': 7, 'store 2': 2},
{'date': dt.date(2021, 5, 1), 'store 1': 3, 'store 2': 14},
{'date': dt.date(2021, 6, 1), 'store 1': 7, 'store 2': 12},
]
s.plt.bar(
data=data, order=0,
x='date', rows_size=2, cols_size=10,
padding='0,1,0,1',
x_axis_name='date',
y_axis_name='revenue / store',
title='Revenue per store, first half - 2021',
)
```

And if you want to show just one variable, for example showing the average height of a thousand trees in the year 2021, you can provide the following data:
```python
data = [
{'date': 'Jan', 'Height': 3},
{'date': 'Feb', 'Height': 3.5},
{'date': 'Mar', 'Height': 4.2},
{'date': 'Apr', 'Height': 5},
{'date': 'May', 'Height': 5.8},
{'date': 'Jun', 'Height': 6.3},
]
s.plt.bar(
data=data, order=0, x='date', rows_size=2, cols_size=10,
padding='0,1,0,1', x_axis_name='month', y_axis_name='height (m)',
title='Evolution: Average Height of 1000 Trees - 2021',
)
```

## Interesting Usages
* Visualizing survey results: Bar charts are a great way to display the results of a survey. For example, you could use a bar chart to show the percentage of people who answered "yes," "no," or "maybe" to a particular question.
Survey results
* Comparing data: Bar charts are also useful for comparing data. For example, you could use a bar chart to compare the sales of different products over a given time period.
Comparative sales of products
## Variants
By setting the parameter `variant` to the following values the appearance of the chart can be changed:
{% tabs %}
{% tab title="Clean" %}
variant="clean"
{% endtab %}
{% tab title="Minimal" %}
variant="minimal"
{% endtab %}
{% tab title="Thin" %}
variant="thin"
{% endtab %}
{% tab title="Clean Thin" %}
variant="clean thin"
{% endtab %}
{% tab title="Minimal Thin" %}
variant="minimal thin"
{% endtab %}
{% tab title="Shadow" %}
variant="shadow"
{% endtab %}
{% tab title="Clean Shadow" %}
variant="clean shadow"
{% endtab %}
{% tab title="Minimal Shadow" %}
variant="minimal shadow"
{% endtab %}
{% endtabs %}
{% hint style="info" %}
### Featured Content
[Changing the Menu Path](/dev/building-web-app/menu/changing-the-menu-path.md)\
The `menu_path` can be modified.
[Using the Grid](/dev/building-web-app/grid/using-the-grid.md)
It is possible to use any number of rows.
{% endhint %}
---
# Agent Instructions
This documentation is published with GitBook. GitBook is the documentation platform designed so that both humans and AI agents can read, navigate, and reason over technical content effectively. Learn more at gitbook.com.
## Querying This Documentation
If you need additional information that is not directly available in this page, you can query the documentation dynamically by asking a question.
Perform an HTTP GET request on the current page URL with the `ask` query parameter, and the optional `goal` query parameter:
```
GET https://docs.shimoku.com/dev/elements/charts/bar-charts/bar.md?ask=&goal=
```
`ask` is the immediate question: it should be specific, self-contained, and written in natural language.
`goal` is optional and describes the broader end goal you are ultimately trying to accomplish on behalf of the user. GitBook uses it to tailor the answer towards what is most useful for that goal.
The response will contain a direct answer to the question and relevant excerpts and sources from the documentation.
Use this mechanism when the answer is not explicitly present in the current page, you need clarification or additional context, or you want to retrieve related documentation sections.